

You poured time and money into getting people to your website. The visitors are showing up. So why isn’t your revenue climbing along with your traffic numbers?
This is the gap that frustrates marketers, founders, and ecommerce owners alike. Traffic on its own means very little. What matters is what people do once they land on your pages—whether they explore, engage, and eventually buy. The bridge between a stranger clicking your link and a customer hitting “purchase” is built on data, and that data comes from website analytics.
In this guide, you’ll learn how to move beyond vanity metrics and use website analytics to understand your visitors, fix the leaks in your funnel, and turn passive traffic into paying customers. We’ll cover the metrics that actually predict conversions, how to read user behavior, and the practical steps you can take to optimize the entire customer journey.
What Website Analytics Really Tells You
 Website analytics is the practice of collecting, measuring, and interpreting data about how people interact with your site. It answers questions that gut instinct simply can’t: Which pages keep people hooked? Where do they bail? What path do your best customers take before they convert?
Too many businesses stop at surface-level numbers. They celebrate a spike in pageviews or a flood of new sessions without asking whether any of those visits lead anywhere. That’s the trap of vanity metrics—they feel good but tell you nothing about the health of your business.
Useful website analytics digs deeper. It connects behavior to outcomes. Instead of asking “how many people visited?”, it asks “how many people visited, what did they do, and how many of them became customers?” When you frame analytics this way, every number becomes a clue in solving the puzzle of why your site does or doesn’t convert.
The Metrics That Actually Drive Conversions
Not all data deserves your attention. Focusing on the right metrics keeps you from drowning in dashboards. Here are the ones that genuinely correlate with revenue.
Conversion Rate
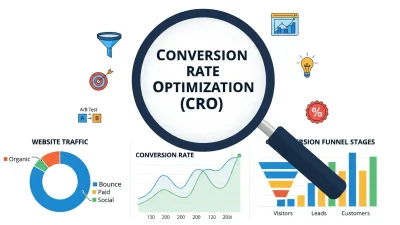
This is the headline metric. Your conversion rate is the percentage of visitors who complete a desired action—a purchase, a sign-up, a download. If 1,000 people visit and 25 buy, your conversion rate is 2.5%. Tracking this number across pages, traffic sources, and devices shows you exactly where your funnel performs well and where it falls apart.
Bounce Rate and Engagement
A high bounce rate—visitors leaving after viewing just one page—often signals a mismatch between what people expected and what they found. Maybe your headline overpromised, your page loaded slowly, or your layout confused them. Pairing bounce rate with engagement metrics like average session duration and pages per session paints a fuller picture of how compelling your content really is.
Traffic Sources
Knowing where your visitors come from is essential for customer journey optimization. Organic search, paid ads, social media, and email each attract people with different intent. A visitor from a branded search may be ready to buy, while someone from a cold social ad needs more nurturing. When you compare conversion rates by source, you learn where to invest your budget and where to cut your losses.
Exit Pages
Exit pages reveal the last thing people see before they leave. If a large share of visitors abandon your site on the checkout page, you’ve found a serious leak. Identifying these drop-off points is one of the fastest ways to improve conversions without spending an extra cent on traffic.
Funnel Drop-Off
Most conversions happen in steps: landing page, product page, cart, checkout, confirmation. Mapping each stage and measuring how many people advance versus disappear shows you precisely where the journey breaks down. A funnel report turns a vague sense that “something isn’t working” into a specific, fixable problem.
How User Behavior Analysis Reveals What Numbers Miss
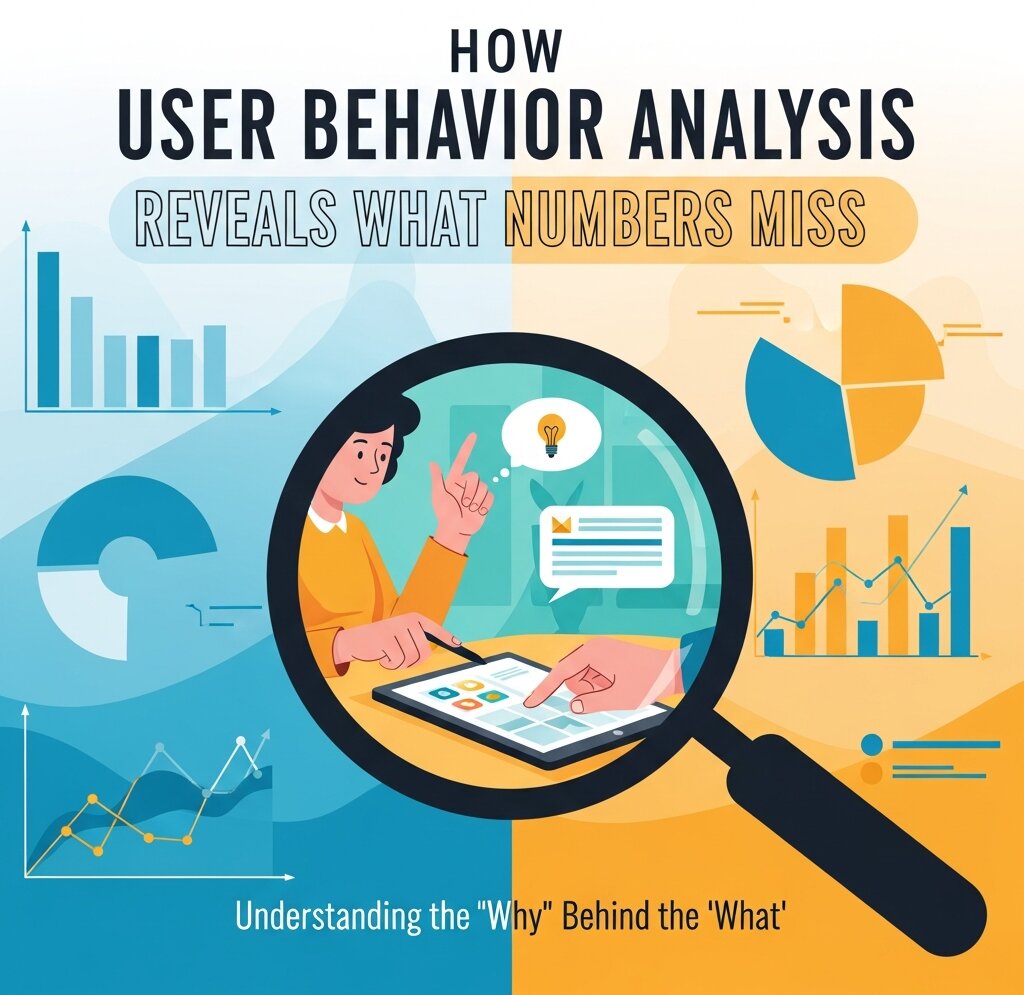 Standard metrics tell you what happened. User behavior analysis tells you why. This is where website analytics gets genuinely powerful, because it lets you see your site through your visitors’ eyes.
Heatmaps are a great starting point. They visualize where people click, how far they scroll, and which elements grab attention. You might discover that visitors never scroll far enough to see your call-to-action, or that they keep clicking an image that isn’t actually a link. These insights are nearly impossible to gather from numbers alone.
Session recordings take it further. By watching anonymized playbacks of real visits, you can spot moments of hesitation, rage clicks, and confusing navigation. Seeing a user struggle with a form field tells you more than any chart ever could.
Then there’s segmentation. Lumping all your visitors together hides the truth. New visitors behave differently from returning ones. Mobile users have different needs than desktop users. By breaking your audience into meaningful groups, you can tailor your user experience optimization efforts to the people who matter most—and stop guessing about what an “average” visitor wants, because that person doesn’t exist.
Turning Insights into Customer Journey Optimization
Collecting data is only half the work. The real value comes from acting on what you learn. Customer journey optimization means smoothing the entire path a visitor takes, from first impression to final purchase and beyond.
Start by mapping that journey honestly. List every stage a customer passes through and identify the friction points your analytics revealed. Maybe people love your blog but rarely click through to your product pages. Maybe they add items to the cart but never check out. Each of these gaps is an opportunity. Next, prioritize. You can’t fix everything at once, so focus on the leaks that are costing you the most revenue. A small improvement to your checkout flow, where high-intent buyers congregate, will usually beat a big change to a low-traffic blog post.
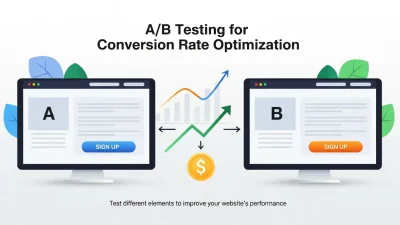
Then test your fixes. This is where A/B testing earns its keep. Rather than assuming a new headline or button color will help, you run a controlled experiment and let the data decide. Test one element at a time so you know exactly what caused any change. Over time, these incremental wins compound into meaningful gains. Finally, close the loop. After you make a change, return to your analytics and measure the impact. Did your conversion rate climb? Did the drop-off shrink? User experience optimization is never finished—it’s a continuous cycle of observe, hypothesize, test, and refine.
Setting Up Your Analytics for Success
Even the sharpest analyst can’t extract insight from messy data. A solid foundation matters.
Define Your Goals First
Before you touch a single dashboard, decide what success looks like. Is it sales, newsletter sign-ups, demo bookings, or content downloads? Your goals determine which conversions you track and which metrics deserve your focus. Without clear goals, analytics becomes a sea of numbers with no shore in sight.
Track the Right Events
Modern analytics platforms let you track specific interactions—button clicks, video plays, scroll depth, form submissions. Set up event tracking for the actions that signal real interest. These micro-conversions often predict macro-conversions and give you early warning when something changes.
Keep Your Data Clean
Filter out internal traffic from your own team, exclude bot activity, and make sure your tracking code fires correctly on every page. Dirty data leads to bad decisions. Audit your setup regularly so you can trust what your reports tell you.
Build Dashboards You’ll Actually Use
A cluttered dashboard gets ignored. Build focused views that surface the handful of metrics tied to your goals. When the important numbers are visible at a glance, you’re far more likely to act on them.
Common Mistakes That Sabotage Your Results
Plenty of businesses collect analytics yet still fail to grow. Here’s what trips them up. Chasing vanity metrics is the biggest culprit. Pageviews and follower counts feel rewarding, but they don’t pay the bills. Anchor your attention to metrics that connect to revenue. Another mistake is analyzing without acting. Reports gathering dust help no one. The goal of website analytics is decisions, not documentation. Every insight should lead to an experiment or a fix.
Many teams also ignore mobile behavior. With mobile traffic dominating most industries, treating it as an afterthought means alienating a huge slice of your audience. Always review your data by device and optimize accordingly. Finally, beware of drawing conclusions from tiny samples. A change that looks dramatic across 50 visitors may vanish across 5,000. Give your tests enough time and traffic to reach statistical confidence before you commit to a decision.
FAQ: Website Analytics
FAQ 1: What is website analytics?
Website analytics is the process of collecting and analyzing data about how visitors interact with your website. It helps businesses understand user behavior, measure performance, and identify opportunities to improve conversions, engagement, and overall user experience.
FAQ 2: Why is website analytics important for businesses?
Website analytics provides valuable insights into where visitors come from, what actions they take, and where they leave your site. These insights help businesses make data-driven decisions that improve marketing effectiveness, customer experience, and revenue growth.
FAQ 3: Which website analytics metrics should I track?
The most important metrics include conversion rate, bounce rate, engagement rate, traffic sources, exit pages, average session duration, pages per session, and funnel drop-off rates. These metrics offer a clearer picture of website performance than vanity metrics alone.
FAQ 4: How can website analytics improve conversion rates?
By identifying user behavior patterns, bottlenecks, and abandonment points, website analytics helps businesses optimize landing pages, checkout processes, calls-to-action, and overall user journeys to increase conversions.
FAQ 5: What is the difference between website analytics and user behavior analysis?
Website analytics focuses on quantitative data such as traffic, conversions, and engagement metrics, while user behavior analysis examines how users interact with a website through tools like heatmaps, session recordings, and click tracking to uncover the reasons behind those metrics.
FAQ 6: How do traffic sources affect website performance?
Different traffic sources attract visitors with varying levels of intent. For example, organic search visitors may be researching solutions, while email subscribers may be closer to making a purchase. Analyzing traffic sources helps businesses allocate marketing budgets more effectively.
FAQ 7: What are heatmaps in website analytics?
Heatmaps are visual reports that show where users click, move, and scroll on a webpage. They help identify which elements attract attention and which areas users ignore, making it easier to optimize page layouts and calls-to-action.
FAQ 8: How often should I review website analytics data?
Businesses should review key metrics regularly—weekly for ongoing performance monitoring and monthly for deeper strategic analysis. Frequent reviews help identify trends, detect issues early, and measure the impact of optimization efforts.
FAQ 9: What are common website analytics mistakes to avoid?
Common mistakes include focusing on vanity metrics, ignoring mobile users, failing to set clear goals, collecting data without taking action, and making decisions based on insufficient data samples.
FAQ 10: How can small businesses get started with website analytics?
Small businesses should begin by defining clear goals, setting up analytics tracking, monitoring essential metrics, and using the insights to make gradual improvements. Starting with a few meaningful KPIs is often more effective than tracking dozens of metrics at once.
Make Every Visit Count
 Website analytics transforms guesswork into strategy. When you stop obsessing over raw traffic and start studying what visitors actually do, you uncover the exact reasons people convert—or don’t. From there, every improvement you make is grounded in evidence rather than hope.
Begin with one clear goal. Track the metrics that map to it. Use user behavior analysis to understand the why behind the numbers, then run small, focused tests to smooth your customer journey. Repeat that cycle, and your conversion rate will climb even if your traffic stays flat.