
Most marketing teams track traffic. Fewer track what happens after a visitor lands on the page. That gap—between attracting an audience and actually converting them—is where revenue is made or lost. Funnel analysis closes that gap. At its core, funnel analysis maps the steps a user takes from first contact with your brand to completing a desired action—whether that’s making a purchase, signing up for a newsletter, or booking a demo. Each step in the funnel is a checkpoint.
And at each checkpoint, some users move forward while others drop off. The goal of funnel analysis is to understand why. Done well, funnel analysis transforms vague intuitions about “what’s not working” into clear, data-backed insights. It helps marketers allocate budgets more effectively, prioritize optimization efforts, and build user experiences that guide people toward conversion rather than pushing them away.
This guide breaks down exactly how funnel analysis works, how to set one up, and how to use the insights it generates to meaningfully improve your marketing performance.
What Is Funnel Analysis, and Why Does It Matter?
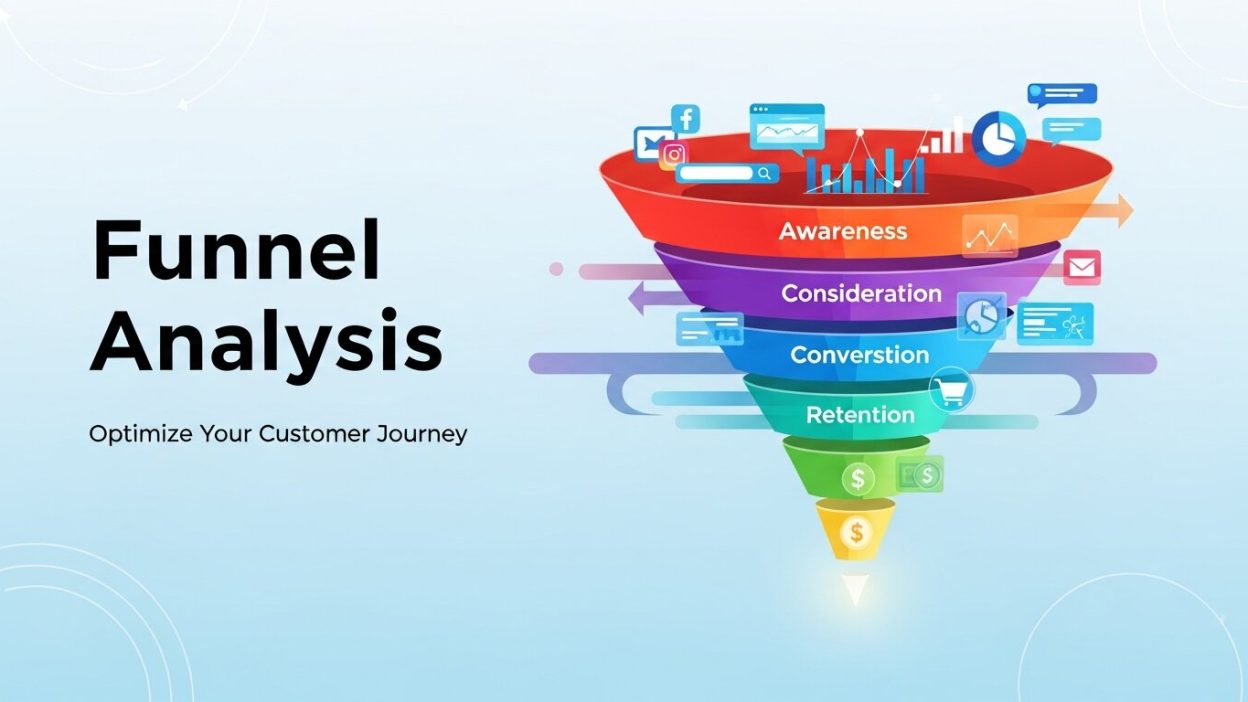
A marketing funnel represents the journey a user takes before converting. The “funnel” metaphor exists because not everyone who enters at the top makes it to the bottom—people drop off at every stage, narrowing the pool as they go.
Funnel analysis is the process of measuring those drop-offs, understanding what’s causing them, and making targeted improvements to increase the number of people who complete each stage.
The reason this matters comes down to ROI. Driving traffic is expensive. Paid ads, content marketing, SEO, and social media all require significant time and resources. If a sizeable portion of that traffic exits at the same predictable point—say, a checkout page, or a sign-up form—you’re spending money to bring people to a door that won’t open. Funnel analysis helps you find that door and fix it.
The Stages of a Marketing Funnel
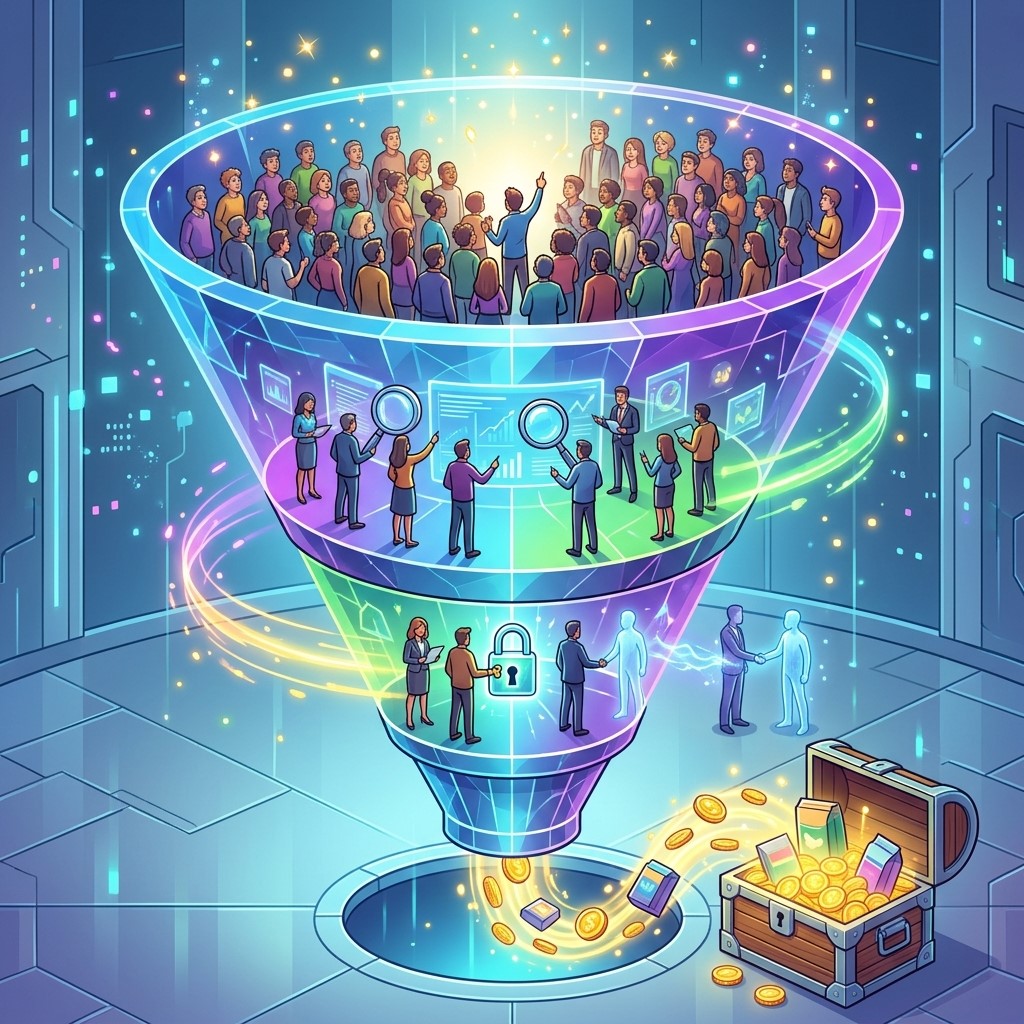 Before you can analyze a funnel, you need to define it. Most marketing funnels are organized around three core stages:
Top of Funnel (ToFu) — Awareness
This is where potential customers first encounter your brand. Traffic sources like organic search, social media, paid ads, and referral links all feed into the top of the funnel. At this stage, users are browsing, exploring, or discovering—they’re not necessarily ready to buy.
Key metrics here include total visits, impressions, click-through rates, and bounce rates from landing pages.
Middle of Funnel (MoFu) — Consideration
Users at this stage have shown some level of interest. They might be reading product pages, comparing options, downloading a resource, or signing up for a trial. This is where nurturing happens—turning passive interest into active intent.
Metrics to watch include page depth, time on site, lead form submissions, and email open rates.
Bottom of Funnel (BoFu) — Conversion
This is the moment of decision. A user either converts—makes a purchase, submits a contact form, schedules a call—or they don’t. Drop-offs at this stage tend to be the most costly because these are your most qualified leads.
Key metrics include conversion rate, cart abandonment rate, cost per acquisition, and revenue per visitor.
How to Set Up a Funnel Analysis
Step 1: Define your conversion goal
Start by identifying what you’re trying to get users to do. Every funnel begins with a clear end goal—whether that’s a completed purchase, a form submission, or a free trial sign-up. Without a defined goal, you’re analyzing movement without direction.
Step 2: Map the steps users take to reach that goal
Work backwards from the conversion event. What pages does a user typically visit before converting? What actions do they take? You might map a funnel that looks like this:
- Homepage → Product page → Pricing page → Sign-up form → Confirmation page
Each of these is a “step” in your funnel, and each one represents a potential drop-off point.
Step 3: Implement tracking through website analytics
To measure what’s actually happening in your funnel, you need reliable website analytics in place. Tools like Google Analytics 4, Mixpanel, or Amplitude allow you to create event-based funnels that track user movement through defined steps. Configure events for each stage—page views, button clicks, form submissions—and make sure they’re firing correctly before you start pulling data.
Step 4: Collect baseline data
Before drawing any conclusions, let the funnel run long enough to gather statistically meaningful data. The volume of data you need depends on your traffic levels, but generally speaking, a few weeks of data is a reasonable starting point.
Step 5: Identify drop-off points
Once data is flowing, look at the conversion rate between each step. Where are users exiting the funnel most frequently? A significant drop between two steps is a signal that something at that stage is causing friction—and that’s where your analysis should focus.
How to Diagnose Problems Using Funnel Data
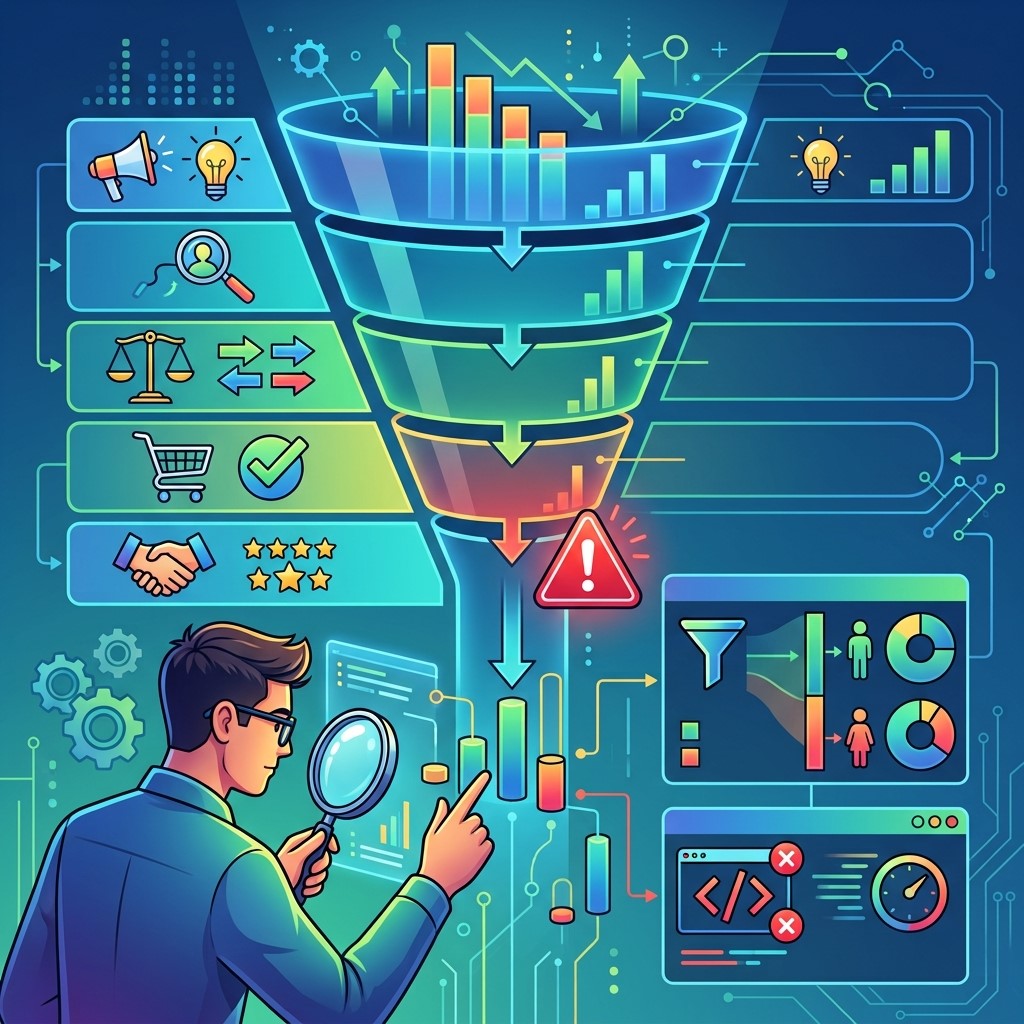 Spotting a drop-off is step one. Understanding why it’s happening is where the real work begins. Here are three methods for diagnosing funnel issues:
User Behavior Analysis
User behavior analysis looks at how people interact with specific elements of your website—what they click, what they ignore, how far they scroll, and where they get stuck. This goes beyond aggregate page-view data to surface the specific moments where users disengage.
Session recording tools like Hotjar or FullStory let you watch real user sessions and observe friction in action. You might notice that users repeatedly click a non-clickable element, that a form field is causing confusion, or that users exit after encountering a loading delay.
Heatmap Analysis
Heatmap analysis visualizes where users are clicking, scrolling, and hovering on a given page. A click heatmap might reveal that users are engaging with the wrong elements—clicking images they expect to be links, for example. A scroll heatmap can show whether key content or calls to action are being seen at all, or whether they’re sitting below a scroll depth most users never reach.
Heatmap analysis is particularly useful for diagnosing drop-offs on high-traffic pages where aggregate data points to a problem, but you need more granular insight to understand what’s happening.
Segmented Funnel Views
Breaking your funnel data down by segment can reveal patterns that overall averages obscure. For example, mobile users might convert at a significantly lower rate than desktop users—suggesting a mobile UX problem. Users arriving from a paid ad campaign might drop off at a higher rate than organic visitors—suggesting a disconnect between ad creative and landing page content.
Segments worth analyzing include device type, traffic source, geographic location, new vs. returning users, and user demographics.
Turning Funnel Insights Into Marketing Improvements
Data without action is just noise. Once you’ve identified where users are dropping off and why, the next step is structured experimentation.
Prioritize by impact
Not all drop-offs are worth addressing immediately. Focus on the steps that have both high exit rates and high traffic volume—these represent the biggest opportunity for improvement. A 20% drop-off on a page that receives 10,000 monthly visitors has a much greater potential impact than a 40% drop-off on a page that receives 200.
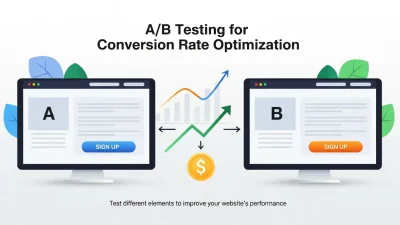
Run A/B tests
For most funnel improvements, A/B testing is the most rigorous way to validate a hypothesis. If you believe a form is causing drop-offs because it asks for too many fields, create a shorter version and test both variants simultaneously. Let the data confirm or challenge the assumption before making a permanent change.
Improve high-exit pages with targeted changes
Some common fixes that consistently improve funnel performance include:
- Simplifying checkout flows — Reducing the number of steps and fields required to complete a purchase
- Strengthening calls to action — Ensuring CTAs are visible, specific, and clearly communicate what happens next
- Improving page speed — Even a one-second delay in load time can significantly increase bounce rates
- Adding social proof — Reviews, testimonials, and trust signals reduce hesitation at the decision stage
- Aligning landing pages with ad creative — Users who click an ad and land on an irrelevant page will exit quickly; the message, offer, and visual language should match
Establish a feedback loop
Funnel optimization is not a one-time project. Markets change, user behavior shifts, and new traffic sources bring different audiences. Build a regular cadence—monthly or quarterly—for reviewing funnel performance data, running new experiments, and updating your assumptions based on what you’re seeing.
Common Mistakes to Avoid in Funnel Analysis
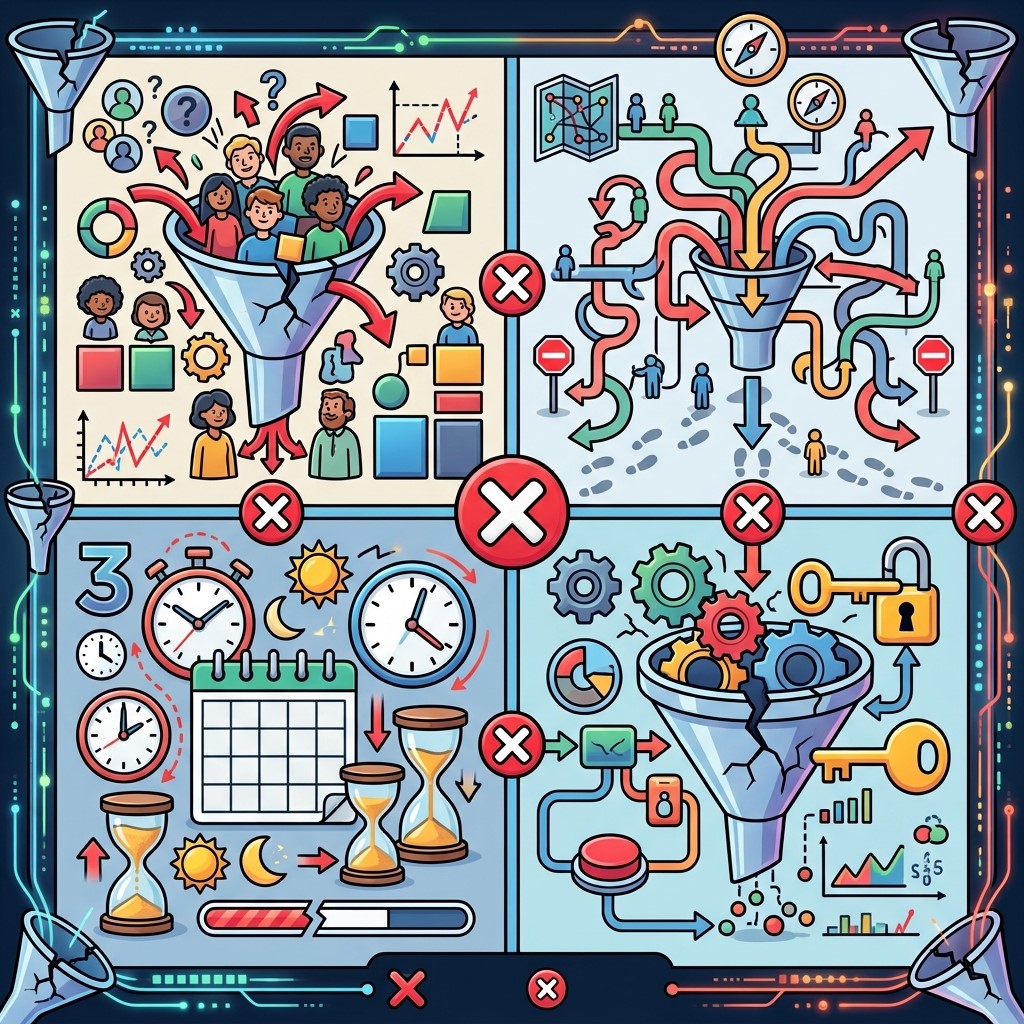 Even experienced teams make missteps when approaching funnel analysis. A few worth flagging:
Analyzing without enough data: Drawing conclusions from small sample sizes leads to unreliable results. Ensure you have sufficient data before acting on any finding.
Treating all drop-offs as problems: Some users exit because they’ve made a decision not to convert—and that’s fine. Not every drop-off represents a fixable issue; context matters.
Optimizing steps in isolation: Changes to one step in the funnel can affect behavior at other steps. Always measure the impact of an optimization on overall funnel performance, not just the step you changed.
Ignoring qualitative data: Website analytics and heatmap analysis tell you what is happening. User interviews, surveys, and support tickets help explain why. Both are valuable.
Frequently Asked Questions (FAQs)
1. What is funnel analysis in digital marketing?
Funnel analysis is the process of tracking and evaluating how users move through each stage of the customer journey, from their first interaction with your brand to completing a desired action. It helps businesses identify where users leave the funnel so they can improve those stages and increase conversions.
2. Why is funnel analysis important?
Funnel analysis is important because it highlights the areas where potential customers drop off before converting. By identifying these friction points, businesses can improve user experiences, optimize marketing efforts, increase conversion rates, and maximize the return on their marketing investment.
3. What are the main stages of a marketing funnel?
The three main stages of a marketing funnel are awareness, consideration, and conversion. During the awareness stage, users discover your brand. In the consideration stage, they evaluate your products or services. Finally, in the conversion stage, they complete an action such as making a purchase or submitting a lead form.
4. Which metrics should I monitor during funnel analysis?
Some of the most valuable metrics include conversion rate, click-through rate, bounce rate, exit rate, cart abandonment rate, cost per acquisition, average session duration, and revenue per visitor. Tracking these metrics helps you understand how users progress through your funnel and where improvements are needed.
5. What tools are commonly used for funnel analysis?
Popular funnel analysis tools include Google Analytics 4, Mixpanel, Amplitude, Hotjar, FullStory, Microsoft Clarity, and Adobe Analytics. These platforms help businesses monitor user behavior, track events, analyze conversion paths, and identify optimization opportunities.
6. How often should I perform funnel analysis?
Funnel analysis should be performed regularly rather than as a one-time project. Reviewing funnel performance every month or quarter allows businesses to identify changing user behaviors, test improvements, and continuously optimize conversion rates.
7. What’s the difference between funnel analysis and customer journey analysis?
Funnel analysis focuses on measuring the steps users take toward a specific conversion goal and identifying where they leave the process. Customer journey analysis is broader, examining every interaction a customer has with a brand across multiple channels before, during, and after making a purchase.
8. How can I reduce drop-offs in my marketing funnel?
You can reduce funnel drop-offs by improving website speed, simplifying forms and checkout processes, creating stronger calls to action, optimizing landing pages, matching ad messaging with page content, and continuously testing different page elements to improve the user experience.
9. Can small businesses benefit from funnel analysis?
Yes. Funnel analysis is valuable for businesses of every size because it helps identify where potential customers abandon the buying process. Even with moderate website traffic, businesses can uncover insights that improve marketing performance and increase conversions.
10. How does funnel analysis improve conversion rates?
Funnel analysis improves conversion rates by revealing where users experience friction and why they fail to complete a desired action. With these insights, businesses can make targeted improvements that create smoother customer journeys, reduce abandonment, and generate more conversions over time.
Making Funnel Analysis Part of Your Marketing Practice
Funnel analysis gives marketing teams a structured, evidence-based way to improve performance without relying on guesswork. By combining website analytics, user behavior analysis, and heatmap analysis, you develop a layered understanding of how users move through your funnel—and what’s stopping them from reaching the end.
The teams that see the greatest gains from funnel analysis are those who treat it as an ongoing discipline rather than a periodic audit. They instrument their funnels carefully, review data consistently, test hypotheses rigorously, and iterate continuously. Over time, these compounding improvements add up—turning a leaky funnel into one that converts efficiently and at scale. Start by mapping your current funnel, implementing proper tracking, and identifying your highest-priority drop-off points. From there, the path forward is clear.